
The impacts of the COVID-19 pandemic will be difficult to predict or parse long term due to a number of variables, including sector, changes in demand and/or likelihood the manufacturer was deemed essential in the spring 2020 closures. However, despite these variables, we can safely assume that issues existing before the pandemic will still affect manufacturers during and after the pandemic.
We’ve heard this via a series of 11 listening sessions organized by the National Institute of Standards and Technology’s Hollings Manufacturing Extension Partnership (NIST MEP) called the “National Conversation with Manufacturers” series. The focus of the conversations is on learning how manufacturers are handling the near-term jolt from the pandemic and preparing for success in the long-term.
One theme that emerged at each session was that although controlling the virus looms large, none of the companies could report that their other problems had disappeared. In fact, their underlying problems remained mostly the same, and in a few places, the issues worsened because the pandemic put pressure on pre-existing soft spots. Understanding the existing landscape remains important; sometimes the more things change, the more they stay the same. Managing issues that existed before COVID-19 will be an important piece of recovery as well as in addressing the new challenges brought on by the pandemic.
The National Perspective
One of the things that has caught the attention of economists is the slow growth in productivity since we emerged from the Great Recession. As the chart below suggests, productivity across the manufacturing sector has been relatively flat since a sharp increase as we emerged from the Great Recession. Since that sharp rebound, productivity has been relatively flat since about Q2 2010 until the COVID-19 recession, when real productivity across the manufacturing sector took a deep dive but is now showing some signs of rebounding.
Figure One

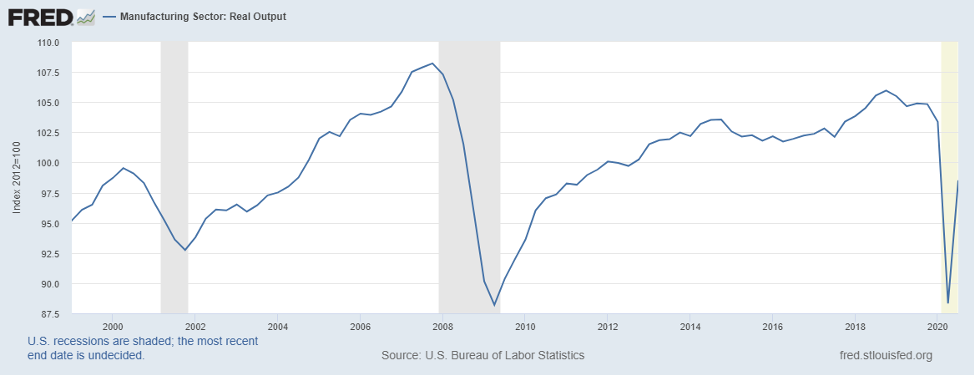
This made me wonder what was behind the flat performance. I decided to look at what has been happening to real output (reflected as the numerator) in the productivity ratio (with the denominator representing hours). The chart below provided an “a-ha” moment in that real output has remained relatively flat since the economy emerged from the Great Recession and well below where it was previously.
Figure Two
That led me to wonder what was happening across the 50 states, and what follows is an analysis of how real output has changed across the country.
Grouping the States
How are states doing in terms of growing their manufacturing GDP (or real output)? I downloaded real (inflation adjusted) manufacturing GDP by state between 2009 and 2019 from the U.S. Bureau of Economic Analysis. What 2020 will hold for the states is an open question. The good news is that, while variable, 38 states saw real manufacturing GDP growth between 2009 and 2019. The bad news is that real manufacturing GDP fell in 12 states over the same period. Over this period, real manufacturing GDP in the U.S. grew at a tepid annual rate of around 1.6%. For comparison, from 1999 to 2007, manufacturing GDP in the U.S. grew nearly twice as fast on an annual basis – at 3.1%.
I divided the states into five groups. I sorted the data from highest growth to lowest and then grouped them on what appeared to be logical break points in the distribution using the “ocular comparison method” (I eyeballed the data). The first two groups of states performed better than the U.S. as a whole by 1.6%. Six states – Arkansas, California, Colorado, Georgia, Indiana and Massachusetts – in the third group grew at annual rates higher than the U.S. overall. In all, manufacturing GDP in 25 states grew faster than overall U.S. GDP during this period.
- Group One includes nine states: Michigan, Montana, New Hampshire, Arizona, South Dakota, Oregon, Nevada, South Carolina and Florida. The group was made up of a handful of states that saw real manufacturing GDP grow by a compound annual growth rate (CAGR) of more than 3% between 2009 and 2019, about twice as high as the national rate. These Group One states were widely dispersed across the nation and reflect different underlying industry distributions that contributed to their above-average growth.
- Group Two comprises 10 states that experienced a compound annual growth rate in real manufacturing GDP between 2-3% annually. Like Group One, this group is growing faster than the nation as a whole. Four states – Ohio, Kentucky, Tennessee and Alabama – form part of the auto belt and their experience reflects in part the turnaround in the auto industry. Three states along the northern tier – Minnesota, North Dakota and Wisconsin – were in this group as well. This group also included Idaho, Kansas and Texas.
- Group Three captures 14 states that grew more slowly than the first two groups, between 1-2% annually. This group, which performed at around the same level as the U.S. overall was scattered across the national map although you can see a cluster of states in New England, including Massachusetts, Rhode Island and Vermont. There is another band of states that I think of as the “I-70” states, including Maryland (where I-70 begins on the eastern side), Indiana, Illinois, Iowa, Missouri, Nebraska and Colorado. Other states in this group include California and Washington along the west coast and Georgia in the southeast.
- Group Four comprises a small group of states that experienced relatively anemic annual growth rates in real manufacturing GDP. These five states are scattered across the map, and include Hawaii, Mississippi, Pennsylvania, Utah and Virginia.
- Group Five includes 12 states that had negative or negligible annual rates of growth in real GDP. This group includes a cluster of states on the eastern seaboard – beginning in North Carolina up through the Mid-Atlantic region (Delaware and New Jersey) and into New York, Connecticut and Maine. There is also a cluster of states that are more resource-dependent manufacturing states – West Virginia, Oklahoma, Wyoming, Louisiana and New Mexico – that may reflect more the vagaries of changes in natural resource prices and demand for goods such as coal and related products.
Figure Three
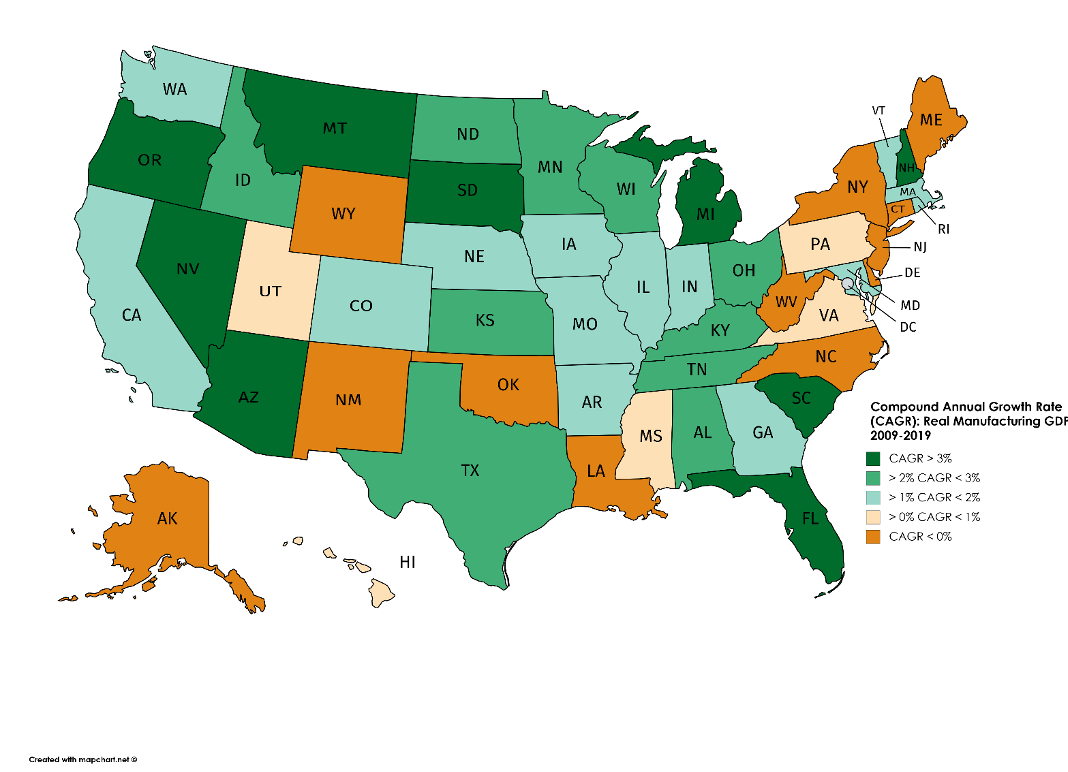
Source: U.S. Bureau of Economic Analysis
The different patterns across the states reflect a host of factors. This includes differences in the mix of manufacturing industries in each of these 50 states and the growth and decline patterns of the manufacturing industries that are most important to each state economy.
The Path Ahead
I was surprised at what I found. The differences across the 50 states were startling. For policymakers, they may need to think how their business climate effects differences in state economic performance. For instance, studies by the Center for Business and Economic Research at Ball State University and the 2020 State New Economy Index published by the Information Technology and Innovation Foundation may point a way forward. These data cast new light on different dimensions of productivity and manufacturing. As I have argued in previous blogs, manufacturing productivity is important, and as we continue to recover from the current crisis, productivity will be even more important to national, state and local economic and company competitiveness. Productivity is typically defined as the ratio between a measure of output and a measure of input (or multiple inputs) used to produce a good or service. Productivity provides a measure of how efficiently production inputs are used to produce or yield a certain level of output. As the BLS suggests in their "Productivity 101” lesson, productivity growth is the means to increase output without increasing inputs or incurring additional costs.
A 2017 McKinsey Global Institute Discussion Paper made clear that not all sources of productivity gains are the same. McKinsey highlights how productivity can be improved through efficiency gains – by reducing the amount of inputs to produce a given output – or by increasing the value or volume of output with the same level of inputs. Indeed, a 2014 paper by Acemoglu and his colleagues highlighted the importance of disaggregating manufacturing productivity into its constituent elements. They found that much of the subpar performance across manufacturing reflected declines in real output alongside declines in employment. I suspect we have spent a lot of time focusing on reducing the denominator in production and not enough time thinking about how to grow the numerator of items produced in the productivity equation.
For the FloridaMakes Network, the path forward (in terms of improving productivity) may be helping companies grow their top line rather than shrinking the denominator. This could include helping companies with market intelligence to highlight growing segments of business and consumer demand as well as things such as growing exports, import substitution or reshoring opportunities. For instance, the recent 2020 State of Manufacturing survey conducted by Enterprise Minnesota found that nearly 60% of the manufacturers surveyed said finding new customers will be the primary driver of future financial growth. Next in line is maximizing productivity (27%), followed closely by developing new products (24%).
Recovering from an economic downturn is always a complex challenge and coming back from the impacts of COVID-19 is likely to be particularly so. However, we can use what we do know to help guide us as we try and chart a path through what we don’t.
Florida’s State of Manufacturing
Learn more about Florida's State of Manufacturing by listening to FloridaMakes CEO, Kevin Carr.
Article was written by Ken Voytek, Manager of the Program Evaluation and Economic Research Group and the Chief Economist with the Manufacturing Extension Partnership (MEP) Program at the National Institute of Standards and Technology (NIST).
#Blog